Real-Time Measurements
With real-time measurements, the result is visible during the measurement. For example, an equalizer can be adjusted directly "on sight". Likewise, you can "look around acoustically" a bit by moving the microphone in the room. This quickly gives a realistic picture of how much the sound field changes and what accuracy is therefore appropriate when making adjustments. This is an advantage over measurements with Logsweep, which by its nature must first play back the complete measurement signal before the result can be calculated.
This advantage is bought by lower accuracy, more sensitivity to noise and loss of temporal resolution. Accordingly, different areas of application have been established for both types of measurement. Especially when only one equalizer is to be adjusted, realtime measurements are the best choice. This is often the case in the car audio sector, for example.
In contrast to music playback at home, temporal correctness plays a subordinate role in car hifi. This text therefore mainly refers to car hifi. The word "car audio" may also include more complex systems with DSP, multiple loudspeakers and subwoofers. It is assumed here that the settings for time correctness in the car audio ("distance of the loudspeakers") have been completed according to the operating instructions.
A prerequisite for all measurements is that the Android device (tablet or phone) with the installed app Hifi Apps Car Audio Setup is connected to the car audio system as for listening to music. At the same time, the app requires a microphone that can be freely moved around the car (except for the pure listening tests). Fixed Android car devices are therefore usually not suitable. If a measurement microphone is needed, it is indicated.
Time correctness less crucial
In a car, by its very nature, the placement of the speakers, damping of the room and location of the listening positions cannot be changed. Fortunately, this is also less important than in normal listening rooms. Roughly speaking, a bass doesn't have the necessary space to resonate at all. Cars (even vans or smaller motor homes) have more the characteristics of a pressure chamber and build up much less room modes. The speakers are close to the listener, so reflections from the walls or windows play little role in time correctness. Who wants to be sure: The app offers the possibility to check this thesis using the impulse response.
Setup
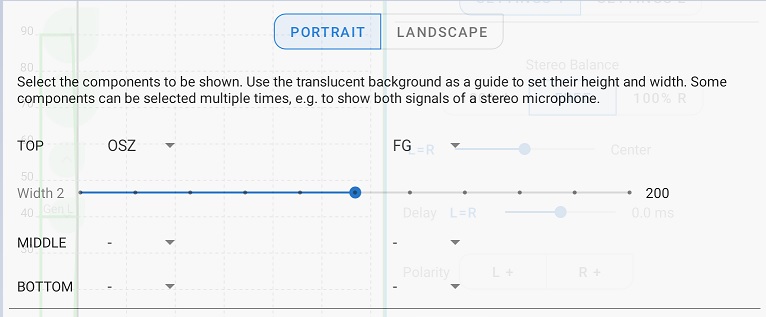
Different views can be defined for real-time measurements. The components oscilloscope, function generator, realtime analyzer and spectrogram can be distributed arbitrarily. The screenshots here correspond to the views after installation: Oscilloscope and Function Generator or Realtime Analyzer and Spectrogram. After one of the two views has been opened, it can be changed with [⚙ All] depending on the screen size and personal requirements:
Function Generator and Oscilloscope
Use in YouTube ⚙ Subtitles for videos in German language.
Function generator and oscilloscope are mostly used to get to the root of unexpected results. Typical errors such as speakers connected with reversed polarity or accidentally turned controls on a crossover can be found, as experience shows, even on high-priced systems that have been installed by established specialist companies. The normal measurement procedures assume freedom from such errors. Sometimes one recognizes in the results only after several correction attempts that something "cannot be" and then regrets not to have measured the system at the beginning with function generator and oscilloscope at least superficially. With the integration of these components into the app, the threshold for this should be reduced.
Operation
The operation should be self-explanatory. If you are still unclear, the following list should help.
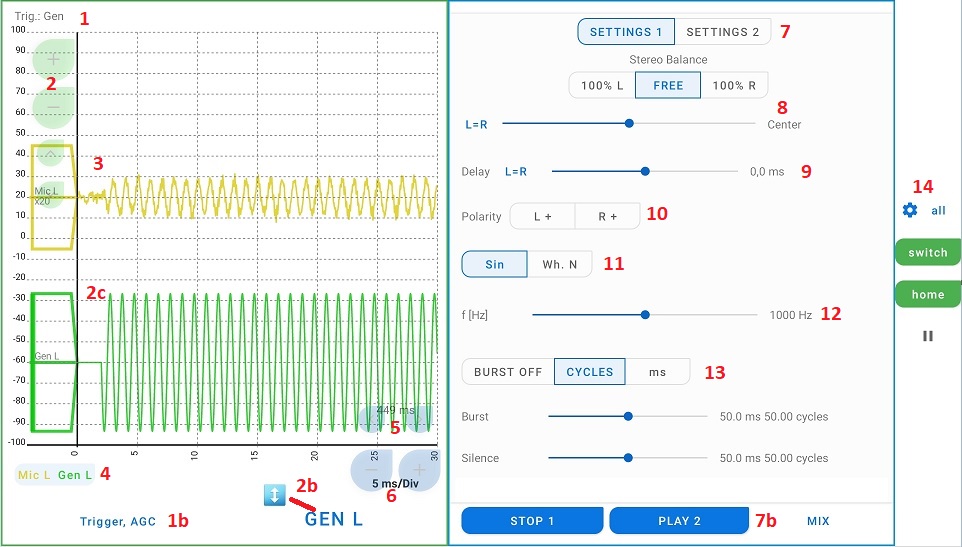
- 1, 1b: Display and setting options for a trigger. When the trigger is switched on, the display of the wave is always started at the same condition, e.g. when it goes from bottom to top through the value 0. In burst mode, the trigger is 2 wave trains before the burst starts. This creates a standing image. When the trigger is off, the display "rolls" from right to left. If the conditions for the trigger are not met, the image freezes. In order to avoid confusion with a crash, the display 1 then flashes red and shows the lettering "wait". "Gen" (function generator) or "Mic" (microphone input) refers to the source of the trigger. For stereo signals, the maximum of both channels is used.
- 2, 2b, 2c: Setting options for amplitude and vertical position of the selected channel. The selection is made with the button 2b below. The amplitude here is the maximum vertical extent on the screen (not volt/div). The units on the screen are arbitrary, the maximum amplitude corresponds to the saturation level of the respective channel. It is shown on the left side of the screen. The green signal of the function generator 2c is fully saturated.
- 3: "Mic L x20" means that the yellow displayed signal of the left (also mono) microphone channel is amplified 20x. The height of the yellow field on the left side corresponds to 100% of the gain. Here, after 20x amplification, the curve has a little less than half the amplitude, so it is about 1/50th of the saturation level at the microphone input. The gain is switched in a 1-2-5 series when AGC (Automatic Gain Control) is on and displayed on the left side. The y-scale are arbitrary units.
- 4: These switches can be used to switch individual channels on and off.
- 5: the buttons (<) and (>) shift the microphone input (yellow) relative to the output of the function generator. The shift in ms depends on the selected X-scale. In this way the curves can be shifted over each other for comparison, a disturbing offset due to the propagation time of the sound and processing time of the device can be compensated. Side effect: By observing both curves for a longer time, it can be ensured that no glitches due to lost samples occur on the Android device used: The microphone curve should not drift to the left.
- 6: Setting of the X-scale (ms/div)
- 7, 7b: Setting and start/stop for 2 independent function generators. With the button [MIX] a control is shown, which can be used to define how the signals of the two generators are mixed.
- 8: Balance setting, i.e. distribution of the output to the right and left channel. The [FREE] button allows free adjustment via the slider. [100% R] and [100% L] cause that only the right or left channel is controlled. They can be used to control a channel alone on a trial basis without losing the current position of the slider. [L=R] sets the slider to the center position.
- 9: Allows you to set a delay between the right and left stereo channels.
- 10: Changes the polarity of the respective stereo channel. The signal should be heard with normal polarity between the speakers. If this is the case only after the polarity of a channel has been changed, this is a sure sign that a speaker is connected with reversed polarity.
- 12: Setting of the frequency.
- 13: Burst Gate. The length of the bursts can be selected in ms or cycles [ms|CYCLES]. The selection in cycles causes the wave train to be cut off at a zero crossing. This avoids pops and each burst has the same waveform as the previous one. Each cycle also has a zero-crossing in the middle (between the upper and lower half-wave), so the snap is 0.5 cycles.
- 14: [⚙ all] opens the setup menu discussed above. Two views can be defined, which can be switched between with [switch]. [home] leads to the central view of the app and [||] or [>] freezes the screen or starts it again..
Use Cases
The function generator and oscilloscope are used all the time for testing of all types. Some suggestions to get you started:
- First, without the app, check by ear if music is coming out of all speakers and if the frequency bands are correct (i.e. if the midrange is coming out of the midrange, etc.).
- Also, without the app, check by ear that the balance knobs and faders (right/left, front/back) are working correctly.
- Start the app and in it a view with function generator and oscilloscope.
- [Settings 1]:
- Balance: Depending on which speaker is being tested, in the example here it starts with [100% L].
- Delay 0, Polarity [L+|R+], [Sin], Burst in [CYCLES]
- frequency depending on the loudspeaker. For the midrange, for example, 1 kHz
- Select "Burst" and "Silence" so that at least the transient is covered, at 1 kHz 20 ms burst duration is certainly sufficient. Successive bursts should not influence each other by reverberation. 100 ms silence will be sufficient in most cases.
- [PLAY]
- Approach the associated loudspeaker with the microphone so that the microphone is as close as possible to the diaphragm. At 1 kHz, this is probably the midrange speaker. Note the appearance of the oscillogram for the microphone signal. Then tap [100% R] and repeat the procedure for the right speaker. If the oscillogram is now upside down compared to the first one, the speaker is probably connected incorrectly. If the signal strengths (gain factor and height of the wave) differ greatly, a control on the crossover may have been inadvertently adjusted. However, mounting-related resonances may also be the cause. If necessary, repeat the measurement with half or double the frequency. If nothing changes, the settings at the crossovers should be checked.
- Now change the frequency and repeat the procedure for the remaining speakers. Also check if the subwoofer responds to signals from both channels.
- Start a view with the function generator (the oscilloscope does not mind, but is not needed)
- Settings:
- Balance: [Free] R=L (Center).
- Delay 0, Polarity [L+|R+], [Sin], Burst in [CYCLES]
- Frequency depending on the loudspeaker. For the midrange, for example, 1 kHz
- Select "Burst" and "Silence" in such a way that at least the transient is covered; at 1 kHz, 20 ms burst duration is certainly sufficient. Successive bursts should not influence each other by reverberation. 100 ms silence will be sufficient in most cases.
- [PLAY]
- The sound source must be located in the center of the speakers. If not, change the balance setting. If that doesn't help, a speaker could be connected incorrectly, hopefully the above checks will help with troubleshooting.
- Change the balance setting. The sound source should move out from the center. "Position" the sound source somewhere well off center, but not yet completely at a speaker.
- Now change the frequency. Ideally, the (phantom) sound source should stay where it is.
- Repeat the experiment, but now use the Delay value instead of Balance.
- Start a view with the function generator and preferably with oscilloscope, if the screen size allows it.
- Function generator settings
- Balance: [Free] R=L (Center).
- Delay 0, Polarity [L+|R+], [Sin], Burst in [CYCLES]
- Frequency approx. 80...100 Hz, Burst [CYCELS] Burst 50 ... 100ms, Silence approx. 200 ... 300 ms
- [PLAY]
- Tappen Sie zum Wenden der Pole gleichzeitig ab beide Polarity-Buttons, sodass [ L+ | R+ ] zu [ L- | R- ] wird.
- Is a sound difference audible? Observe whether the oscillogram of the microphone shows any other changes in addition to the "headstand".
Check after loudspeaker mounting
Typical errors during installation are speakers connected the wrong way round, accidentally twisted controls on the crossover or speakers connected to the wrong output of the crossover (mixed up cables) or swapping the R/L channels.
Stereo Panorama
Our sense of perception locates a sound source mainly by the difference in volume and the difference in time with which it reaches both ears. Other effects, thanks to which, for example, unilaterally deaf people can also locate sound sources, can be disregarded here.
This type of transit time and intensity stereophony can also be used outside the recording studio, in playback: Recording and mixing cannot anticipate later listening conditions, nor the different characteristics of different auditory canals - web search "HRTF" for more. That's why there are various approaches to mix the stereo channels in a frequency-dependent manner, even during playback. (With vinyl records, this is done at both ends of the frequency range for technical reasons during manufacture - otherwise the needle will jump out of the groove). This mixing of the channels can lead to a pleasant, more natural listening experience. However, detailed procedures for mixing the channels according to frequency have not yet been established; "crosstalk and cancellation" have been the subject of research for decades. A simple recipe is recommended: If the highs migrate very strongly to the side, it may help not to let the tweeters radiate directly to the ears. This allows more indirect sound to reach the ears and reduces channel separation. Pivot-mounted tweeters can be rotated away for this purpose. Diffusers or sound distribution lenses are another possibility.
"Anyway AC"
A persistent rumor is that the absolute polarity is not audible when connecting speakers, only the polarity of both boxes to each other.
If the sound difference is audible, however, it remains unclear whether it is an artifact due to the asymmetrical design of the loudspeaker. This is supported by the fact that the oscillogram usually also shows clear differences depending on the polarity - regardless of the fact that it is upside down. The contribution of the microphone to this effect will be small: With the small excursion of the microphone diaphragm, the difference of the vibration components towards the room or towards the cabinet is certainly much less pronounced than with the loudspeaker.
Einschwingverhalten
In "Check after loudspeaker assembly" is also the transient response of the system can be seen. The microphone signal (yellow) does not exactly match the burst of the function generator (green). The main cause is the mechanical behavior of the loudspeaker and, depending on how far away the microphone is, the behavior of the environment. Not all visible differences in the transient are audible and expensive systems with many drivers often have a visually worse transient than simpler ones. Therefore, the results should not be overinterpreted, but they are suitable for comparing the two stereo channels in addition to the check (see above). Non-linearities due to defects are also visible. For quantifiable results, however, other methods are used - see e.g. klippel.de .
Listening tests
In addition to the highest audible frequency, the two function generators can be used to switch back and forth to find the smallest audible differences between two signals. For example, set [SETTINGS 1] to 998 Hz and [SETTINGS 2] to 1000 Hz. Check if the difference is audible.
Realtime Analyzer and Spectrogram
The following screenshot shows a Realtime Analyzer (RTA) at the top and a spectrogram at the bottom. The RTA shows the instantaneous distribution of sound pressure at different frequencies. Essentially, there are two fields of application: Either a noise signal is used as the signal and a frequency response that is as uniform as possible is set, or non-uniformities are specifically tracked and their cause is searched for.
The lower half of the image shows the spectrogram. Instead of the height of the curve in the RTA, different colors are shown here. Bright green corresponds to a high value in the frequency curve of the RTA and blue to a low value. This allows the y-axis to be used otherwise, namely to show the time evolution of the spectrum.
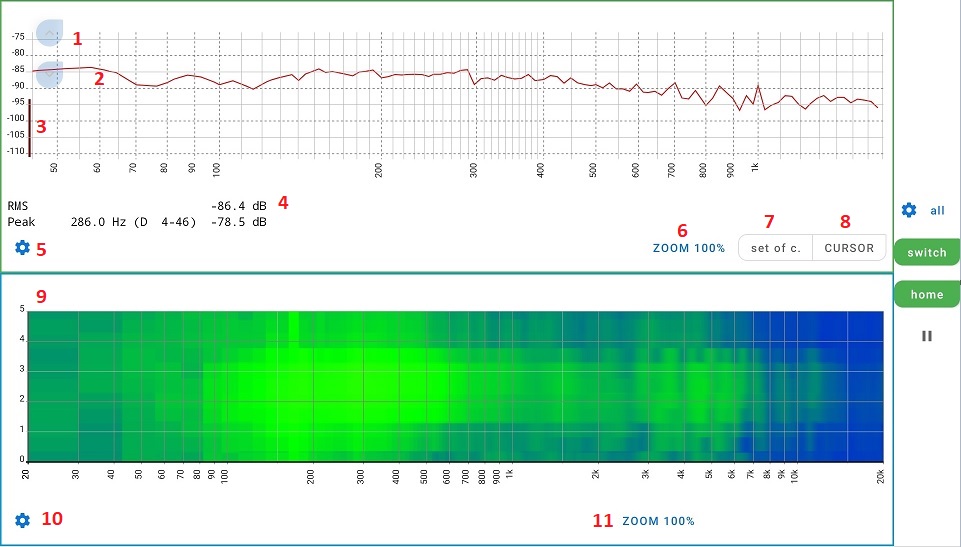
- 1: Buttons for shifting the dB scale. Depending on the application, full scale can be set to 0 dB, for example, or a calibrated sound pressure meter can be used as a reference to orient the scale to the standardized reference point.
- 2: Measuring curve. Details of Fourier transform, windowing, dB/dBA can be set in [⚙ All].
- 3, 4: VU Meter i.e. a bar to display the sound pressure. In the setup it is possible to switch between dB or dBA. In the "Peak" line, the frequency with the highest sound pressure is displayed, together with the pitch and deviation in cents (concert pitch at 440 Hz).
- 5: Opens the setup settings for the respective RTA, i.e. if several RTA's are displayed, e.g. for both stereo channels, the values can be adjusted independently. General values are set in [⚙ All].
- 6: After zooming with 2-finger gestures, the display can be reset with this button.
- 7: [set of c.] creates a number of snapshots of the display curve to give an overview of fluctuation width and average values. [CURSOR] displays a cursor.
- 9: Time scale in seconds
- 10: Setup for the respective spectrogram, analogous to 5.
- 11: analogous to 6.
Use Cases
The spectrogram is used less frequently in audio engineering. Sometimes it is useful to find noise at certain frequencies. The light green vertical stripe at about 180 Hz is an example. Likewise, the frequency distribution of typical driving noises can be observed - depending on personal taste, it is possible to specifically mask them with music. For this purpose, the corresponding frequencies have to be raised a bit on the equalizer. A popular legitimization is that the ear tires in this frequency range and the boost compensates for that. Not only in the car, but also in the recording studio and when listening to music at home, the ears can get tired in certain frequency ranges. "Ear fatigue" develops unnoticed and slowly. Spectrogram or RTA can then provide objective information whether a certain frequency range is really set too strong or weak.
The RTA is used wherever, on the one hand, the frequency spectrum is to be recorded quantitatively and, on the other hand, changes are to be seen immediately. In addition to adjustment work, the response of the frequency response can also be examined when the microphone is moved from wall to wall in the listening room. In principle, resonances and also cancellations and amplifications due to reflected waves can be found with an RTA in this way. However, the temporal behavior, which is ultimately responsible for the "imaging", sense of space, accentuation in the bass range, cannot be measured. Next, the Evaluation of frequency response can be done.
Equalizer setting
Prerequisite: The system has been checked for errors as described above. If a separate equalizer is available for each speaker, this should be used and the speakers should be calibrated separately. The environment should be as quiet as possible, the engine should not be running, doors and windows should be closed.
The goal is to achieve a uniform frequency response. "Uniform" does not have to mean flat, just free of narrowband peaks and dips. The app allows you to fade in various fixed target curves that have proven themselves in different situations. Even when calibrating a recording studio, the goal is not a flat frequency response, but a drop of about 2 dB at high frequencies. Initially, the same target curve should be used for each loudspeaker.
- Create a view with function generator and RTA
- If individual speakers can be calibrated separately, set the balance and fader so that only these speakers receive a signal.
- Set white noise [Wh. N] as the signal of the first function generator.
- Open the setup menu of the RTA and select one of the target curves. If in doubt, the EBU3276 curve is a good start. The curve can be moved vertically with the slider below the curve selection. If necessary, start the function generator with [PLAY]. Then move the target curve to the upper area of the trace. (The overlay is slightly transparent so that the wide target curve and the measurement curve are visible).
- Close the overlay so that the curves can be seen better.
- Now move the individual controls of the equalizer on the car audio system so that the upper part of the measurement curve matches the target curve.
- Do not try to compensate for extreme dips. If a single control is significantly higher than the rest, the car audio will output significantly more power for that frequency range only (10 times the power at 10 dB). The saturation level is reached when this frequency range is fully modulated. The entire remaining frequency range then only plays at 10% of the possible power.
- Frequency response overshoots are much more noticeable than dips and should be controlled away.
- Repeat the steps for the other speakers.
- It does not hurt to write down the settings in addition to saving them (battery change, theft, reset, defect).
If interested, small corrections can be made afterwards: For a pleasant sound distribution, the rear speakers often have to be operated at a significantly lower level. On the other hand, if the highest possible overall level is to be achieved, the power should be distributed as evenly as possible among the speakers. To achieve this, the high frequencies above about 2 kHz can be lowered by a few dB in the rear speakers. This allows a higher level to be set at the rear without giving the impression that the sound is coming from behind.
The frequency sensitivity of the auditory sense depends strongly on the direction of incidence of the sound (web search "HRTF"). Measurement microphones with an omnidirectional pickup pattern are naturally unable to reproduce this. If you notice that, for example, hi-hats move to the rear, this may be the cause. In this case, you should also consider lowering the high frequencies for the rear speakers.
Measurement Microphone
In Microphone calibration difference between uncalibrated built-in microphone and a measurement microphone is shown. Usually built-in microphones have a not very balanced overall frequency response, but below 2...4 kHz no narrow humps and valleys. So for a provisional adjustment, where only such humps and valleys are to be eliminated, the built-in microphone will probably do. A balanced ratio of highs and lows should then be adjusted by ear. A measuring microphone allows a more systematic approach, but here too the target curve is ultimately selected according to personal preferences.
Measurement microphones supplied with receivers or very inexpensive measurement microphones differ from professional microphones probably mostly by a lower sensitivity: They therefore require higher sound pressure. This is important for "zooming in" on subtleties later, but does not play a role in the car. Personal opinion: Customer reviews reduce the risk of getting a completely unusable model. Professional microphones that have not been reviewed for years are no better.
Logsweep Measurements
For a before-and-after comparison and to finally check the settings, Hifi Apps Car Audio Setup also offers logsweep measurements. They are technically more complex than real-time measurements, but provide more comprehensive and accurate results. In addition to the frequency response, the result also includes the impulse response. See Evaluation of the impulse response for more.